Extensions
21 files
-
Analysing unknown binaries especially malware drivers without symbols is a very tedious affair. This WinDBG extension is an effort to reduce the tediousness by transferring the names IDA generated to WinDBG. Run the IDC script to dump names to a sym file and use the extension in WinDBG to resolve the symbols from that file. The IDC script (tested in IDA Free 5 only and hacks are IDA Free 5). It loads the inputfile and gets IMAGE_NT_HEADERS->OptionalHeader->BaseofCode and creates a variable to subtract which is the difference between IDC function FirstSeg()-BaseofCode (namely ImageBase). Then enumarates Name from FirstSeg() to MaxEA(); and dumps the bare offsets (RVA - IMAGEBASE ) and names to a file c:\\idasym\\GetInputFile().idasym in a format compatible to strtoul&sprintf() like: 00000300,DriverEntry 00017ce5,SomeCrapFunction() 00100000,aURLhttp://malwarebasedotcom/malware/foo.exe Bare offsets are dumped because it doesnt require rebasing in IDA and wouldnt have to worry about ASLR in WinDBG. Also bare offsets can help in naming virtual allocated blocks manually create an idasymfile with offset, name point it with an address in WinDBG and all offsets relative to that address will be named appropriately. Simply analyse with IDA and MakeName (visible in names window | publics) run the IDC script in IDA to overwrite an existing idasym file or create a new one. Do !addsym in WinDBG for an updated disassembly.
- 103 Downloads
 Teddy RogersUpdated
 -
Driver replacement mappings are very useful during development process of kernel mode drivers when drivers files need to be replaced often. It saves a lot of time since you don't need to copy binaries manually across the network. This method can be used for any kernel mode driver/module.
Driver replacement entry consists of driver path and file name on target system (the one that will be replaced) and driver path and file name on host system (e.g. location where your build system creates drivers' binaries). Each time your driver is about to be loaded it will be first uploaded from host. So basically to replace driver with its new version you just need to restart it on your target system.
!kdfiles extends standard version of WinDBG/KD .kdfiles command that is used to define driver mappings.
!kdfiles extension has some additional features comparing to built-in command:
Mappings are automatically saved and all the settings persist thru WinDBG/KD restarts. There is also no need for manual creation or loading INI files. Any mapping can be enabled, disabled or removed at any time without changing INI file. Each time !kdfiles is executed it updates information about CPU architecture for every file on the mapping list and it disables those mappings which are not matching current CPU architecture on the target system. Several UI improvements make some tasks faster and easier to perform. Syntax
!kdfiles map_file !kdfiles -a [old_driver] !kdfiles -m old_driver new_driver !kdfiles -i [options] !kdfiles -s save_file !kdfiles -e map_id !kdfiles -d map_id !kdfiles -c map_id !kdfiles -? Parameters
map_file Defines driver replacement map file (it uses the same format as INI files for .kdfiles command). -a Adds driver replacement entry to the current list. Option causes open dialog box to be displayed to specify new driver file. -m Adds driver replacement entry to the current list (same as -m option from .kdfiles). old_driver Defines driver path and file name that will be replaced on target system. new_driver Defines new driver path and file name on host system. new_driver binary will replace old_driver binary when it will be loaded by a target system. -i Switches to ignore machine architecture mode. options off - Turns off ignore machine architecture mode. -s Saves all mappings to a specified file. save_file Defines path and file name of the file where mappings will be saved. -e Enables specified mapping. -d Disables specified mapping. -c Removes specified mapping. map_id Defines identifier number of a given mapping. -? Displays help. Comments
Running !kdfiles without any arguments displays the current list of mappings:
[\systemroot\system32\drivers\dynambus.sys] 0 d [X64] c:\winddk\7600.16385.1\src\general\toaster\kmdf\bus\dynamic\objchk_win7_amd64\amd64\dynambus.sys 1 d [IA32] c:\winddk\7600.16385.1\src\general\toaster\kmdf\bus\dynamic\objchk_win7_x86\i386\dynambus.sys 2 i [IA32] c:\winddk\7600.16385.1\src\general\toaster\kmdf\bus\dynamic\objchk_wxp_x86\i386\dynambus.sys 3 d [X64] c:\winddk\7600.16385.1\src\general\toaster\kmdf\bus\dynamic\objfre_win7_amd64\amd64\dynambus.sys 4 d [X64] c:\winddk\7600.16385.1\src\general\toaster\wdm\bus\objfre_win7_amd64\amd64\busenum.sys 5 e [X64] c:\winddk\7600.16385.1\src\general\toaster\wdm\bus\objchk_win7_amd64\amd64\busenum.sys [\systemroot\system32\drivers\nonpnp.sys] 6 d [X64] c:\winddk\7600.16385.1\src\general\ioctl\kmdf\sys\objchk_win7_amd64\amd64\nonpnp.sys 7 d [X64] c:\winddk\7600.16385.1\src\general\ioctl\kmdf\sys\objfre_win7_amd64\amd64\nonpnp.sys [\systemroot\system32\drivers\osrusbfx2.sys] 8 d [X64] c:\winddk\7600.16385.1\src\usb\osrusbfx2\kmdf\sys\step1\objchk_win7_amd64\amd64\osrusbfx2.sys 9 d [X64] c:\winddk\7600.16385.1\src\usb\osrusbfx2\kmdf\sys\step2\objchk_win7_amd64\amd64\osrusbfx2.sys [\systemroot\system32\drivers\pcidrv.sys] 10 d [invalid] c:\winddk\7600.16385.1\src\general\pcidrv\wdm\hw\objchk_win7_x86\i386\pcidrv.sys 11 i [invalid] c:\winddk\3790.1830\src\general\pcidrv\wdm\hw\objchk_win7_x86\i386\pcidrv_32bit.sys 12 d [invalid] c:\winddk\7600.16385.1\src\general\pcidrv\kmdf\hw\objchk_win7_amd64\amd64\pcidrv.sys 13 d [X64] c:\winddk\7600.16385.1\src\general\pcidrv\kmdf\hw\objfre_win7_amd64\amd64\pcidrv.sys 14 d [IA32] c:\winddk\7600.16385.1\src\general\pcidrv\wdm\hw\objchk_wxp_x86\i386\xp_pci_drv_free.sys 15 i [IA32] c:\winddk\7600.16385.1\src\general\pcidrv\wdm\hw\objchk_win7_x86\i386\win7_pci_32_free.sys 16 e [X64] c:\winddk\7600.16385.1\src\general\pcidrv\kmdf\hw\objchk_win7_amd64\amd64\win7_x64_chk_pcidrv.sys Mappings are grouped by old drivers. Each old driver can have one or more new drivers on its group, however only one new driver in a given group may be enabled.
All active UI elements are displayed with blue underlined font. By clicking on old driver name standard open dialog box will pop up where you can select new driver to be added (it's equivalent to executing !kdfiles -a old_driver). New entry will automatically become enabled unless new driver's binary is incorrect/invalid (e.g. file is courrupted or CPU architecture of a file is not matching CPU architecture of a target system).
System requirements
!kdfiles has been tested with version 6.12.2.633 of WinDBG and KD. Note that DML elements of !kdfiles output will not work under KD. Target system has to run Windows XP or newer version of Windows (driver mappings are not supported on older systems).
Currently only x86 and x64 host systems are supported. Please contact me if you need IA-64 build.
Installation and configuration
Simply copy bldbgexts.dll from zip file to a destination of your choice. To load the extension run following command in WinDBG/KD: .load path\bldbgexts.dll. You may also want to save your workspace so next time extension will be loaded automatically.
You can use _NT_DEBUGGER_EXTENSION_PATH environment variable to define path that the debugger will search first for extensions DLL files.
Uninstallation
Once the extension is loaded you can unload it with the .unload path\bldbgexts.dll command. Alternatively close your debugger and delete bldbgexts.dll file.
- 91 Downloads
Teddy RogersUpdated -
Over the course of the last few months, I've really put lots of effort into understanding and utilizing WinDbg. As a primarily C# developer, this meant also becoming intimately familiar with the SOS extension. Though a bit tedious, this exercise has already paid rich dividends in my debugging experience. As powerful and handy as SOS is, however, it has some annoying limitations and quirks. My personal peeves with SOS, combined with my desire to learn to write a WinDbg extension, led me to develop SOSEX, a debugging extension for managed code that begins to alleviate some of my frustrations with SOS. SOSEX (available in x86 and x64 versions) provides 8 easy-to-use commands: !dumpgen (dumps the contents of a GC generation), !gcgen (indicates the GC generation of a given object), !refs (lists all references to and from the specified object), !bpsc (breakpoint, source code), !bpmo (breakpoint, method offset), !vars (dump all args and local variables), !isf (inspect static field) and !dlk (deadlock detection).
The rest of this post will provide a bit more detail about each command and how they can save you time. Use the !help command for a list of commands and !help <command name> for the syntax and usage of each command.
!dumpgen and !gcgen
With SOS, you can dump the contents of the heap like so:
0:000> !dumpheap -short 00000642787c7370 00000642787c7388 00000642787c73b0 00000642787c7410 00000642787c7440 00000642787c7498 00000642787c74f0... The problem with this is that there is no easy way to tell from the output which generation each object belongs to. You can follow up the call to !dumpheap with !eeheap -gc, which will provide the necessary information to determine generations. However, determining the contents of, say, generation 2 using this method is very tedious. Here's the output of !eeheap -gc for a dual-processor system in server GC mode:
0:000> !eeheap -gc Number of GC Heaps: 2 ------------------------------ Heap 0 (0000000002264180) generation 0 starts at 0x000000007fff0098 generation 1 starts at 0x000000007fff0080 generation 2 starts at 0x000000007fff0068 ephemeral segment allocation context: none segment begin allocated size 0000000002271b80 00000642787c7370 0000064278809088 0x0000000000041d18(269592) 000000007fff0000 000000007fff0068 0000000080002fe8 0x0000000000012f80(77696) Large object heap starts at 0x00000000ffff0068 segment begin allocated size 00000000ffff0000 00000000ffff0068 00000000ffff80c8 0x0000000000008060(32864) Heap Size 0x5ccf8(380152) ------------------------------ Heap 1 (0000000002264e00) generation 0 starts at 0x00000000bfff0098 generation 1 starts at 0x00000000bfff0080 generation 2 starts at 0x00000000bfff0068 ephemeral segment allocation context: none segment begin allocated size 00000000bfff0000 00000000bfff0068 00000000bfff00b0 0x0000000000000048(72) Large object heap starts at 0x000000010fff0068 segment begin allocated size 000000010fff0000 000000010fff0068 000000010fff0080 0x0000000000000018(24) Heap Size 0x60(96) ------------------------------ GC Heap Size 0x5cd58(380248) As you can see, you have a lot of work to do in order to pick through the output of !dumpheap and compare object addresses to the segment addresses provided by !eeheap -gc. Enter SOSEX's !dumpgen command. Using !dumpgen, you can easily determine the contents of a given generation simply by providing the number of the generation you wish to examine:
0:000> !dumpgen 2 00000642787c7370 24 System.Object 00000642787c7388 38 System.String STRVAL=length 00000642787c73b0 94 System.String STRVAL=ArgumentOutOfRange_MustBeNonNegNum 00000642787c7410 46 System.String STRVAL=startIndex 00000642787c7440 84 System.String STRVAL=ArgumentOutOfRange_StartIndex 00000642787c7498 86 System.String STRVAL=ArgumentOutOfRange_IndexLength 00000642787c74f0 42 System.String STRVAL=capacity... Conversely, if you know an object's address and you wish to know what generation it belongs to, you can simply provide the address of the object to the !gcgen command.
!refs
Though not a replacement, the !refs command supplements SOS's !gcroot command by allowing you to view the immediate references from and to a given object.
0:000> !refs 0000000080000db8 Objects referenced by 0000000080000db8 (System.Threading.Mutex): 0000000080000ef0 32 Microsoft.Win32.SafeHandles.SafeWaitHandle Objects referencing 0000000080000db8 (System.Threading.Mutex): 0000000080000e08 72 System.Threading.Mutex+<>c__DisplayClass3 0000000080000e50 64 System.Runtime.CompilerServices.RuntimeHelpers+CleanupCode The sample output above shows only heap references, but !refs will also list all references from handles, stacks, registers and the freachable queues.
!dlk
The !dlk command allows you to easily spot deadlocks in your application if you suspect deadlock to be the cause of an application hang. If !dlk detects deadlock, the output will list the sync blocks that are held as well as the sync blocks for which each thread is waiting, as well as the type, method, IL offset, and, if symbols are available, the source code and line number at which each thread is waiting:
0:010> !dlk Deadlock detected: CLR thread 4 holds sync block 00000000024c6970 OBJ:000000007fff0f80[System.String] STRVAL=SYNC1 waits sync block 00000000024c6928 OBJ:000000007fff0fa8[System.String] STRVAL=SYNC2 CLR thread 5 holds sync block 00000000024c6928 OBJ:000000007fff0fa8[System.String] STRVAL=SYNC2 waits sync block 00000000024c6970 OBJ:000000007fff0f80[System.String] STRVAL=SYNC1 CLR Thread 4 is waiting at ConsoleTestApp.ConsoleTestApp.MonitorDeadlockThreadProc()+0xa4(IL) [C:\dev\ConsoleTestApp\ConsoleTestApp.cs, line 195] CLR Thread 5 is waiting at ConsoleTestApp.ConsoleTestApp.MonitorDeadlockThreadProc()+0xa4(IL) [C:\dev\ConsoleTestApp\ConsoleTestApp.cs, line 195] 1 deadlock detected. As you can see, !dlk makes it dead simple to troubleshoot this common kind of deadlock in managed code. One important caveat holds true for !dlk: it only works for deadlocks on "sync blocks". Put more simply, it will only spot locks created by Monitor.Enter (which is used by the C# lock keyword). !dlk will not catch deadlock on other types of synchronization objects, such as mutexes and semaphores.
!bpsc and !bpmo
Although managed debugging with WinDbg has become more supported in later builds, it is still difficult to get managed source code breakpoints to work correctly. With the !bpsc command, it is now simple to set source code breakpoints. !bpsc allows you to set a breakpoint in a source code file at a specified line number and, optionally, column number. I've often wanted to stop the execution of my application either deep inside a method in the BCL or in one of my own methods in a build for which I have no symbols. Though SOS provides the handy !bpmd command, !bpmd only allows you to set a breakpoint on the first instruction of a method. This is often not effective for more difficult debugging scenarios. The !bpmo command now provides a means for you to set a breakpoint at specific IL offset within a given type and method.
!vars and !isf
Once you are stopped at a breakpoint, you need an easy means to inspect the contents of method arguments, local variables and instance and static fields. !vars dumps the values of arguments and local variables. If symbols are available, !vars will display the names of the local variables. Names of arguments are (with rare exception) provided even without symbols. In order to inspect member variables, first call !vars and then provide the value of "this" to the sos!do command. Using SOS, it is a bit of a cumbersome process to view the contents of static fields. The !isf command makes it simple by allowing you to simply specify the type and field name to inspect.
- 228 Downloads
Teddy RogersUpdated -
This project can help to automate debugging and crash dump analysis using Python. It allows one to take the best from both worlds: the expressiveness and convenience of Python with the power of WinDbg!
If you want to automate the debugger but dislike the WinDbg built-in script machine syntax it's time to try again using the handy and powerful Python language. Even if you don't want to create your own script, maybe some existing scripts will be of interest to you?
You should have installed python. Supported python: 2.7, 3.5, 3.6, 3.7 or 3.8 Install pykd with command: 'pip install pykd' Use windbg extension (bootstrapper) to run pykd with windbg- 122 Downloads
Teddy RogersUpdated -
We are happy to release the first version of WinDbg (X64) extension to facilitate learning memory analysis pattern language developed by Software Diagnostics Institute and used in our training courses.
The current standard version 1.0 can be downloaded from here.
Here is a usage example:
0:000> .load patterns 0:000> !help Patterns Debugger Extension DLL (Version 1.0.0.0 [std]). Copyright © 2015 Software Diagnostics Services. All rights reserved. Commands: lst - Shows the current list of memory analysis pattern categories lst category - Shows the current list of memory analysis patterns for the specified category sdl abbreviation - Opens a pattern description from Software Diagnostics Library chk - Shows the current memory analysis checklist categories chk category - Shows the current memory analysis checklist for the specified category eula - Shows license terms 0:000> !lst Memory Analysis Pattern Categories: Hooksware Patterns [H] Wait Chain Patterns [W] DLL Link Patterns [L] Memory Consumption Patterns [M] Dynamic Memory Corruption Patterns [C] Deadlock and Livelock Patterns [D] Contention Patterns [N] Stack Overflow Patterns [O] .NET / CLR / Managed Space Patterns [.] Stack Trace Patterns [S] Symbol Patterns [Y] Exception Patterns [E] Meta-Memory Dump Patterns [-] Module Patterns [!] Optimization Patterns [I] Thread Patterns [T] Process Patterns [P] Executive Resource Patterns [X] Falsity and Coincidence Patterns [F] RPC, LPC and ALPC Patterns [R] Malware Analysis Patterns [@] 0:000> !lst S Stack Trace Patterns: Stack Trace [STRA] Stack Trace Collection (unmanaged space) [STCU] Special Stack Trace [SSTR] Exception Stack Trace [ESTR] Dual Stack Trace [DSTR] Truncated Stack Trace [TSTR] Managed Stack Trace [MSTR] Incorrect Stack Trace [ISTR] Stack Trace Set [STSE] Stack Trace Collection (managed space) [STCM] Stack Trace Collection (predicate) [STCP] Empty Stack Trace [EMST] Stack Trace Collection (I/O requests) [STCI] Stack Trace Change [STCH] First Fault Stack Trace [FFST] Critical Stack Trace [CSTR] RIP Stack Trace [RSTR] Glued Stack Trace [GSTR] Rough Stack Trace [ROST] Past Stack Trace [PSTR] Stack Trace (I/O request) [STIO] Stack Trace (file system filters) [STFS] Stack Trace (database) [STDB] Variable Subtrace [VSUB] Technology-Specific Subtrace (COM interface invocation) [TSCI] Technology-Specific Subtrace (dynamic memory) [TSDM] Technology-Specific Subtrace (JIT .NET code) [TSJN] Technology-Specific Subtrace (COM client call) [TSCC] Internal Stack Trace [INST] Stack Trace Collection (CPUs) [STCC] Stack Trace Surface [STSU] Hidden Stack Trace [HSTR] The patterns are shown in the order they originally appeared in Memory Dump Analysis Anthology volumes. The four-character codes for !sdl command are for pro version which will be released soon for users of Software Diagnostics Library.
The extension also shows Windows Memory Analysis Checklist via !chk command.
- 90 Downloads
Teddy RogersUpdated -
Have you ever needed to set a breakpoint on an entire module or memory region?
This is particularly useful if you want break on code execution in a module without specifying any function names directly. Let's say that between point A and point B, some code calls into module C, and corrupts its data.
In Visual Studio, you can set data breakpoints, which will break the debugger when a value changes. Very useful indeed, but you cannot break on a read access.
In the powerful Windbg, we are equipped with hardware breakpoints via the "ba" command (break on access), which works more or less the same as the page fault breakpoint I will explain. It has unfortunately a very strict limitation regarding the size. According to the documentation, the size can only be 1, 2 or 4 bytes, except when it concerns PAGE_EXECUTE, in that case the maximum size is 1 byte. This makes it harder to break over a large memory area.
In its strict sense, we are not going to set a breakpoint, but what we do can be used as a breakpoint, since we are making the debugger break on certain conditions which we can control.
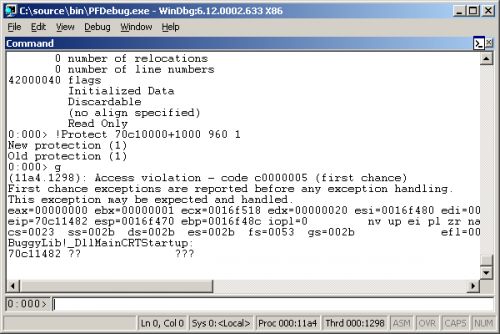
What we will do is to change the access flag of memory pages, from PAGE_EXECUTE_* into PAGE_NOACCESS or PAGE_READONLY. When a function call is made into non-executable pages, it results in an access violation, which will break the debugger. At that point, you can inspect the callstack, variables, and memory regions. If you want to continue executing, you simply restore the access flag to its previous value, and tell the debugger to continue executing.
The same principle can be applied for data. Normally, memory pages where data is stored are marked PAGE_READWRITE. If you suspect memory corruption, you can simply mark the pages PAGE_READONLY, so whenever someone tries to modify the data, you will get an access violation.
- 92 Downloads
Teddy RogersUpdated -
MEX Debugging Extension for WinDbg can help you simplify common debugger tasks, and provides powerful text filtering capabilities to the debugger.
System Requirements:
Windows 10, Windows 7, Windows 8, Windows Server 2008, Windows Server 2012
Debugging Tools for Windows, .NET Framework version 4.5
Installation Instructions:
1. Download the mex.exe archive.
2. Extract to any folder.
3. Use the following command to load the "MEX Debugging Extension for WinDbg" into the debugger: .load (extracted folder)\mex.dll. For a full listing of commands type: !mex.help. For more information on specific commands type: !mex.help command name, or !commandname -?
- 97 Downloads
Teddy RogersUpdated -
DumpPE is a WinDBG extension that dumps PE files from memory.
It contains two commands:
!dumppe.dump_raw - dumps a PE file from memory to disk as-is (the result will be a PE file as it appears in memory (after relocations, things will be located where they should be based on RVAs, etc.)
!dumppe.dump_disk - dumps a PE file from memory to disk and attempts to write it as it was before being loaded - therefore making it a valid PE that can be loaded again at will.
- 116 Downloads
Teddy RogersUpdated -
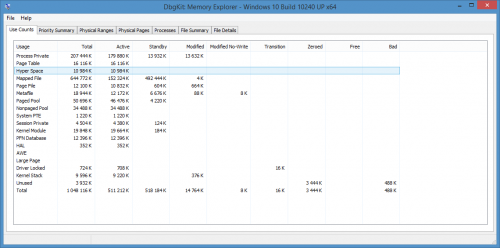
DbgKit is the first GUI extension for Debugging Tools for Windows (WinDbg, KD, CDB, NTSD). Process Explorer displays hierarchical view of processes and detailed information about each process including its full image path, command line, start time, memory statistics, vads, handles, threads, security attributes, modules, environment variables and more. Memory Explorer displays physical memory usage information and detailed information about each physical page. Object Explorer displays Object Manager's namespace and information about objects. Device Explorer displays PnP Manager's device tree and information about devices.
- 154 Downloads
Teddy RogersUpdated -
Debugger extension for the Debugging Tools for Windows (WinDbg, KD, CDB, NTSD).
Commands
st - Displays system service table idt - Displays interrupt descriptor table How to Debug
Open the project in Visual Studio. In Solution Explorer, open the shortcut menu for your project and then choose Properties. In the Property Pages dialog box, open the Configuration drop-down list and then select Debug. In the Property Pages dialog box, open the Platform drop-down list and then select Win32 or x64. In the left pane of the dialog box, expand Configuration Properties and then select Debugging. In the right pane, select Command and then set the path to the WinDbg.exe: C:\Program Files (x86)\Windows Kits\8.1\Debuggers\x64\windbg.exe or C:\Program Files (x86)\Windows Kits\8.1\Debuggers\x86\windbg.exe In the right pane, select Command Arguments and then set the command line arguments: -c ".prefer_dml 1;.load dbgext" -z "D:\CrashDumps\livekd.dmp" In the right pane, select Environment and then set the PATH environment variable: PATH=$(OutDir);%PATH% Choose the OK button. Press F5 or use Debug > Start Debugging to debug.- 89 Downloads
Teddy RogersUpdated -
CMKD.dll is an extension DLL for the "Debugging Tools for Windows Package. It implements the commands !stack, !kvas, !ptelist and !packet. CodeMachine plans to add commands useful to developers and support engineers to CMKD.dll over time. CMKD.dll automatically checks for updates and informs the user when updates are available. The user is responsible for downloading and installing the updates.
This document lists all the commands currently implemented in CMKD.dll.
- 114 Downloads
Teddy RogersUpdated -
This windbg debug extension works as data mining for .NET. THE EXTENSION DOES NOT REQUIRE SOS OR PSSCORX TO WORK. It access .NET debugging API directly without intermediary.
Getting started
Open WinDBG. Load netext Make sure you open the appropriate 32-bits or 64-bits extension (32-bits dumps require winbg 32-bits and netext 32-bits) For detailed help, run: ".browse !whelp" Run: "!windex -tree" and follow the instructions All the rest will be intuitive For scripts, see !wfrom and !wselect Download the training material here: [https://netext.codeplex.com/releases/view/611486] - Training material is NOW up-to-date. Common Resources List of available commands Examples
You can do select like queries to .NET objects including sublevel fields.
For example, to get the url of a HttpContext it is necessary to
!do the httpcontext instance, get address of _request !do the HttpRequest instance, get the address of _url !do the URI instance, get the address of m_String !do the instance of the string object. Using netext you only need to issue a command like: !wselect _request._url.m_String, _response._statusCode from 0x242afe8
- 116 Downloads
Teddy RogersUpdated -
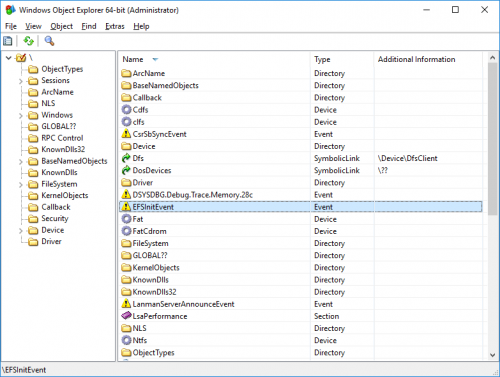
WinObjEx64 is an advanced utility that lets you explore the Windows Object Manager namespace. For certain object types, you can double-click on it or use the "Properties..." toolbar button to get more information, such as description, attributes, resource usage etc. WinObjEx64 let you view and edit object-related security information if you have required access rights.
System Requirements
WinObjEx64 does not require administrative privileges. However administrative privilege is required to view much of the namespace and to edit object-related security information. WinObjEx64 works only on the following x64 Windows: Windows 7, Windows 8, Windows 8.1 and Windows 10, including Server variants. WinObjEx64 also supports running on Wine, including Wine Staging. In order to use all program features Windows must be booted in the DEBUG mode.- 97 Downloads
Teddy RogersUpdated -
This project includes an extension for the windbg debugger as well as a driver code, which allow you to manipulate the virtual machine network traffic and to integrate the wireshark protocol analyzer with the windbg commands.
The motivation of this work came from the intention to find a handy general-purpose way to debug network traffic flows under the Windows OS for the purposes of dynamic software testing for vulnerabilities, for reverse engineering of software and just for fun.
Theory of operation
The main idea is to rely on the Windows Filtering Platform capability to inspect traffic at the application level of OSI (however, the method works well on any level introduced by the WFP API). This gives us a way to intercept and modify any data, which goes through the Windows TCP/IP stack (even the localhost traffic), regardless of the application type and transport/network protocol. Modification and reinjection also work excellent: the operating systems does all the dirty work, reconstructing the transport and network layer headers, for example, as if we were sending the data from the usermode winsock application.
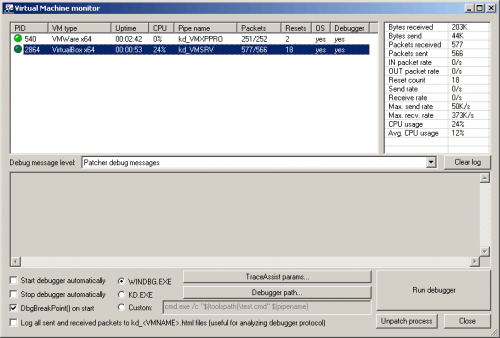
This tool needs a virtualized enviroment (it works fine with VMWare Workstation now) with windbg connected to the virtual machine as a kernel debugger. Installation is done in two steps: driver installation and extension loading in windbg. Driver intercepts network traffic, allows the windbg to modify it, and then reinjects packets back into the network stack. The extension on its turn implements simple interface for packet edit and also uses Wireshark to display data flows. The extension is executed on the host machine, while the driver is located on the virtual machine. To interact with its driver, windbg extension sets the corresponding breakpoints with its own callbacks right inside the driver code. Every time a packet comes in or out, a breakpoint is hit and the windbgshark extracts the app-level payload of the current packet, constructs a new pcap record and sends it to Wireshark. Before the packet is reinjected back, user may modify it, and the Wireshark will re-parse and show the modified record.
- 96 Downloads
Teddy RogersUpdated -
This is a sample extension for Windbg that can be built using Visual Studio.
The extension uses the EngExtCpp framework that enables access to engine API interfaces via C++ class members.
Build Instructions
Make sure Windbg is installed. Copy the inc and lib folders from the sdk folder of Windbg to the sdk folder of sample extension. The sample extension is now ready to be built.- 91 Downloads
Teddy RogersUpdated -
WinDbg text highlighting, support x64.
How to use:
The hs.dll into the 32-bit the windbg installation directory - hs-x64.dll into the 64-bit (x64) windbg the installation directory, Run WinDbg, enter the command
. Load hs
64-bit
. Load hs-x64
Note:
The first time you run will produce asm.ini file, which can set the color, assembly instructions, if UAC is open to ordinary privileges to run windbg may not asm.ini to produce only need administrator privileges to run windbg then loaded once on the line.
- 118 Downloads
Teddy RogersUpdated -
WDBGARK is an extension (dynamic library) for the Microsoft Debugging Tools for Windows. It main purpose is to view and analyze anomalies in Windows kernel using kernel debugger. It is possible to view various system callbacks, system tables, object types and so on. For more user-friendly view extension uses DML. For the most of commands kernel-mode connection is required. Feel free to use extension with live kernel-mode debugging or with kernel-mode crash dump analysis (some commands will not work). Public symbols are required, so use them, force to reload them, ignore checksum problems, prepare them before analysis and you'll be happy.
Requirements
Microsoft Visual Studio 2017 WDK and SDK for Windows 10, version 1709 (10.0.16299.0) Visual C++ Redistributable for Visual Studio 2017 Supported commands
!wa_scan !wa_systemcb !wa_objtype !wa_objtypeidx !wa_objtypecb !wa_callouts !wa_pnptable !wa_crashdmpcall !wa_ssdt !wa_w32psdt !wa_checkmsr !wa_idt !wa_gdt !wa_haltables !wa_colorize !wa_chknirvana !wa_eop !wa_cicallbacks !wa_ciinfo !wa_drvmajor !wa_lxsdt !wa_psppico !wa_systables !wa_apiset !wa_process_anomaly !wa_w32psdt !wa_w32psdtflt !wdrce_copyfile !wdrce_cpuid Supported Targets
Microsoft Windows XP (x86) Microsoft Windows 2003 (x86/x64) Microsoft Windows Vista (x86/x64) Microsoft Windows 7 (x86/x64) Microsoft Windows 8.x (x86/x64) Microsoft Windows 10 (x86/x64) Multiple targets debugging is not supported!
Windows BETA/RC is supported by design, but read a few notes. First, i don't care about checked builds. Second, i don't care if you don't have symbols (public or private). IA64/ARM is unsupported (and will not).
- 103 Downloads
Teddy RogersUpdated -
VirtualKD is a tool that improves your kernel debugging performance with VMWare and VirtualBox. It seamlessly integrates with WinDbg and dramatically reduces debugging latency. Just run the Virtual Machine Monitor, select a VM and press "Run debugger". A ready-to-go WinDbg window will appear and a faster-than-ever debugging session will start.
Features
Significantly improves kernel debugging performance with VMWare and VirtualBox. Supports Windows XP to Windows 10, 32-bit and 64-bit. Fixes truncated Driver Verifier load messages. Compatible with WinDbg and VisualDDK. Easy installation.
- 113 Downloads
Teddy RogersUpdated -
SwishDbgExt is a Microsoft WinDbg debugging extension that expands the set of available commands by Microsoft WinDbg, but also fixes and improves existing commands. This extension has been developed by Matt Suiche (@msuiche) – feel free to reach out on support@comae.io ask for more features, offer to contribute and/or report bugs.
SwishDbgExt aims at making life easier for kernel developers, troubleshooters and security experts with a series of debugging, incident response and memory forensics commands. Because SwishDbgExt is a WinDbg debugging extension, it means it can be used on local or remote kernel debugging session, live sessions generated by Microsoft LiveKd, but also on Microsoft crash dumps generated to a Blue Screen of Death or hybrid utilities such as Comae DumpIt.
- 107 Downloads
Teddy RogersUpdated -
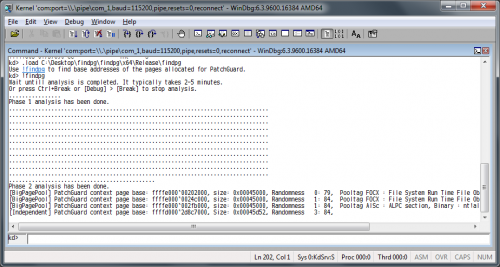
This is an Windbg extension to find kernel pages allocated by PatchGuard. This program allows us to know how many PatchGuard contexts are running on a target environment and will help security researchers who want to analyze PatchGuard on their own.
Installation
Make sure that Visual C++ Redistributable Packages for Visual Studio 2013 has already been installed. Start WinDbg (only x64 version of WinDbg is supported) Either attach a target kernel, open a crash dump file or start local kernel debugging session using livekd. Load the extension by the following command. .load <fullpath_to_the_DLL_file> If you copied findpg.dll into a <WINDBG_DIR>/winext folder, you can omit a path. .load findpg Use !findpg to display base addresses of pages allocated for PatchGuard. or !help to display usage of this extension. !findpg Sample Output
The first field shows a type of memory region Base address is the address of beginning of the pages allocated for a PatchGuard context. The contents will be encrypted. Size is a size of the region. Apparently, it should always be page align when it is PatchGuard's page. The first field of randomness is the number of 0x00 or 0xff in the first 100 bytes of the page. If the page is really encrypted, it should be relatively low number such as less than 5. The second field of randomness is the number of unique bytes in the first 100 bytes of the page. When the page is really encrypted, it should be relatively high number such as greater than 70. The remaining texts are description of the Pooltag. If the pooltag seems to be some third party related one, it will not be a PatchGuard page. On the other hand, if it seems to be a legitimate tag, it does NOT mean that it is NOT a PatchGuard page. Supported Platforms
Host:
Windows 7 SP1 x64 and later x64 Debugger Target:
Windows Vista SP2 x64 and later- 104 Downloads
Teddy RogersUpdated -
Psscor4 can help you diagnose high-memory issues, high-CPU issues, crashes, hangs and many other problems that might occur in a .NET application; in scenarios involving live processes or dump files. If you are familiar with SOS.dll, the managed-debugging extension that ships with the .NET Framework, Psscor4.dll provides a superset of that functionality. Most of the added functionality helps you identify issues in ASP.NET. For example, Psscor4 provides the ability to view:
• managed call stacks (with source mappings)
• managed exception information
• what types are in the managed heap and their reference chain
• which ASP.NET pages are running on which thread
• the contents of the ASP.NET cache
• and much more.
System Requirements:
Windows 7, Windows Server 2003, Windows Server 2008, Windows Vista, Windows XP
Windows 7;Windows Server 2003;Windows Server 2008;Windows Server 2008 R2;Windows XP You will also need to have the Debugging Tools for Windows installed. Psscor4 supports debugging applications running on .NET Framework 4
Installation Instructions:
Download the Psscor4 self-extracting archive.
Run and extract to a location of your choosing.
• For a full listing of commands, load psscor4 in the debugger and type "!help".
• For more information on specific commands you can type "!help command name".
• Additionally, the ASP.NET debugging blog has posts which cover how to use the tool to solve specific types of problems and other helpful guidance. Please note, the architecture type of the Windows debugger needs to match the architecture type of Psscor4. For example, if you need to debug a 32-bit application, you need to use the 32-bit debugger and load the x86 version of Psscor4.dll.
- 213 Downloads
Teddy RogersSubmitted
Download Statistics
- 2,173 Files
- 380 Comments
- 894 Reviews
-